Disclaimer
:- This blog is nothing related to
Covid-19 information / guidelines. This is using data provided by ecdc (European Centre for Disease Prevention and Control) for data analysis and data
ploting in graphs in python.
|
First create blob
storage in Azure to use , here in Azure we will save CSV files which receive
from ecdc.
Second register
for Data bricks community edition from
here.
|
Once you have Data
Bricks community edition, create one notebook for python
 |
Now open the
python file.
First command is
to mount the Azure blog Storage where we can save the CSV File.
 Above path /mnt/covid19/ is mount for using at data bricks |
Now download the
Covid19 Data from ecdc site via get request and save it with today's date if
this file already exists then use the same else create a new one.
 |
Now read the CSV
File and do the grouping and filtering
 |
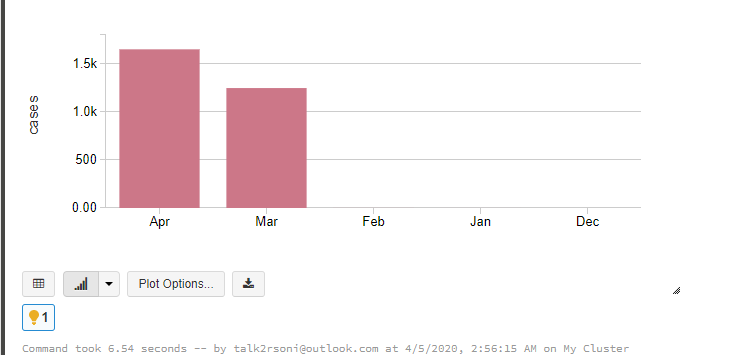
Above will display
the graph like below
 |
Showing posts with label Data Science. Show all posts
Showing posts with label Data Science. Show all posts
Sunday, April 5, 2020
Data Analysis and graph by PySpark


Subscribe to:
Posts (Atom)